
Stock Analysis
Technical Analysis of Indian Energy Exchange (IEX): A Potential Bottom Formation
Introduction
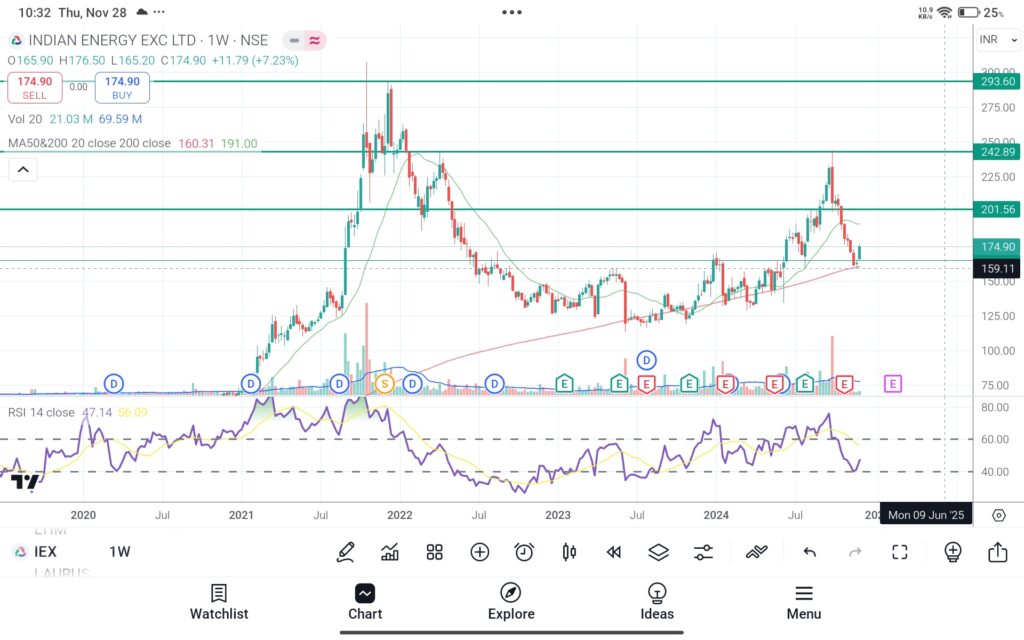
Indian Energy Exchange (IEX), a leader in India’s power trading sector, has seen a significant correction of 29% from its last swing high of ₹242. Currently, the stock is showing signs of stabilization at its key support level of ₹161, which aligns with its 200-day moving average (DMA) on the weekly chart. With technical indicators suggesting a potential bottom formation, IEX presents itself as a low-risk accumulation opportunity for medium-term investors.
Disclaimer: The following analysis is for educational purposes only. This is not a recommendation to buy or sell. Please consult a certified financial advisor before making investment decisions.
Key Technical Observations
- Significant Correction
IEX has corrected 29% from its previous high of ₹242, a level last seen during a broader market rally.
Such corrections often provide long-term investors with an opportunity to enter the stock at more reasonable levels.
- Support at ₹161
The stock is currently holding at ₹161, a critical support level visible on the weekly chart.
This level aligns with IEX’s 200-DMA, reinforcing the strength of this support zone.
- RSI Reversal from 40
On the weekly chart, the Relative Strength Index (RSI) is taking support at 40 and is beginning to reverse upward.
This reversal suggests that the stock is forming a probable bottom, marking the end of the recent downtrend.
Entry, Stop-Loss, and Targets
Entry Levels
Investors can consider accumulating the stock at current levels or on dips to ₹161.
Stop-Loss (SL)
A strict stop-loss at ₹159 ensures minimal downside risk in case the support fails.
Target Levels
₹201: The first target, representing a recovery from the current consolidation phase.
₹242: The second target, aligned with the last swing high, offering significant upside potential in the medium term.
Why IEX Could Be a Low-Risk Bet
Strong Support Zone: The ₹161 level, supported by the 200-DMA, creates a strong technical base for the stock.
Momentum Reversal: The RSI reversal from 40 indicates improving momentum, suggesting that the selling pressure is abating.
Favorable Risk-Reward Ratio: The stop-loss at ₹159 limits risk, while the upside targets of ₹201 and ₹242 offer attractive returns.
Conclusion
Indian Energy Exchange (IEX) is showing signs of bottom formation after a sharp correction from its swing high. With key support at ₹161, the stock’s ability to hold above its 200-DMA and the RSI reversal signal a potential recovery. Investors can consider accumulating the stock at current levels or on dips, with a stop-loss at ₹159 and medium-term targets of ₹201 and ₹242.
As always, conduct thorough research or consult a financial advisor before making any investment decisions.
Market Overview
Latest Post
- Indian Energy Exchange
 Technical Analysis of Indian Energy Exchange (IEX): A Potential Bottom… Read more: Indian Energy Exchange
 - CAPACITES INFRA PROJECTS PVT LTD.
 Technical Analysis of Capacit’e Infraprojects Ltd – A Potential Cup… Read more: CAPACITES INFRA PROJECTS PVT LTD.
 - PSP Projects Pvt Ltd.
 Technical Analysis of PSP Projects – Recovery Signals and Potential… Read more: PSP Projects Pvt Ltd.
 - Technical Analysis of ICICI Prudential Life Insurance Co. Ltd. – Breakout, Retest, and Targets
 Introduction ICICI Prudential Life Insurance Co. Ltd. is a leading… Read more: Technical Analysis of ICICI Prudential Life Insurance Co. Ltd. – Breakout, Retest, and Targets
 - MAHINDRA & MAHINDRA SWING TRADING
 Technical Analysis of Mahindra & Mahindra Stock – Key Breakout… Read more: MAHINDRA & MAHINDRA SWING TRADING
 - ESCORTS KUBOTA SWING TRADING BREAKOUT
 Technical Analysis of Escorts Kubota Stock – Key Levels, Indicators… Read more: ESCORTS KUBOTA SWING TRADING BREAKOUT
 - CAMPUS ACTIVEWEAR LTD: STOCK ANALYSIS AND MARKET TRENDS
 Introduction In the fast-paced world of stock trading, technical analysis… Read more: CAMPUS ACTIVEWEAR LTD: STOCK ANALYSIS AND MARKET TRENDS